- Glassnode’s report reveals a robust accumulation trend among Bitcoin HODLers, with the ATS reaching 1.0, signalling a shift from selling to holding.
- Long-term HODLers are increasingly retaining their assets, with a notable transition of 374,000 BTC to LTH status amid ongoing market fluctuations.
- Analyst Miles Deutscher anticipates a market upturn in Q4/Q1 after a period of apathy, based on historical chart patterns and current market trends.
A recent report by Glassnode shows that despite the recent downturn and continued volatility HODLers are doubling down and accumulating crypto.
Related: Bitcoin Analyst Ben Cowen Says BTC Dominance in Final Stretch, Is Altseason Near?
After Bitcoin peaked in March, the market underwent a period of selling but is now showing signs of shifting back to accumulation, as indicated by the highest Accumulation Trend Score (ATS) of 1.0, the report noted.
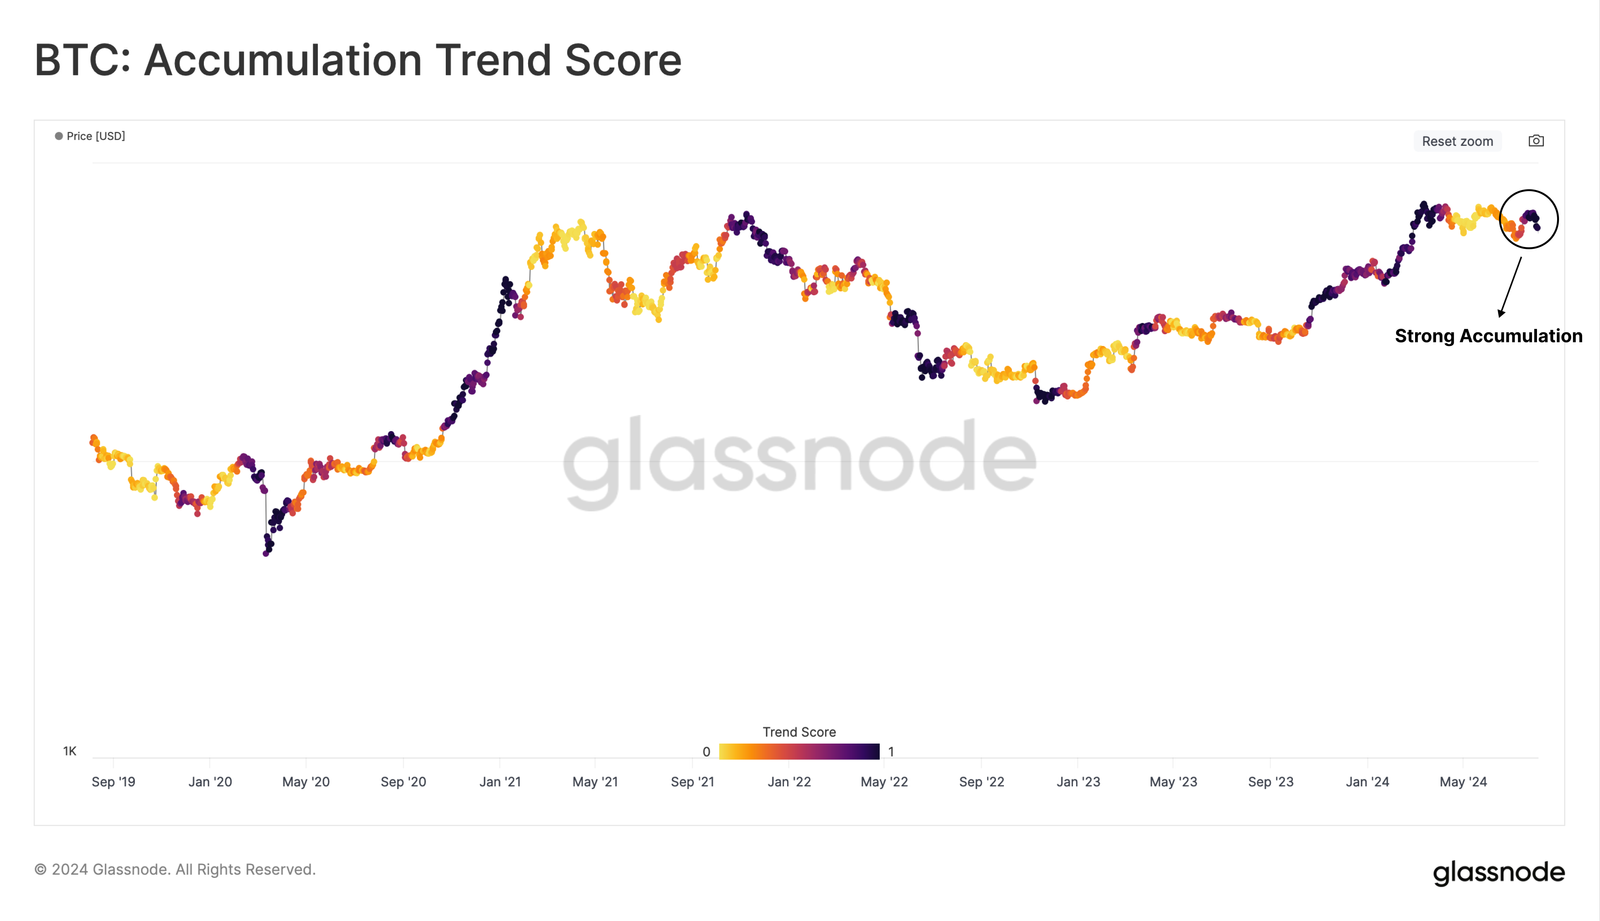
Long-Term Holders (LTH), who had previously sold off their holdings during the price peak, are now increasingly holding onto their assets, with 374,000 BTC recently moving into LTH status. This suggests a shift in investor behaviour from spending to holding, the analysts wrote. They added that not only are investors holding, but they are also accumulating:
Despite challenging and choppy market conditions, Long-Term Bitcoin Holders remain remarkably steadfast in their conviction, with evidence they are ramping up accumulation behaviour. Additionally, the lack of panic selling amongst this cohort in lieu of the largest price contraction of the cycle highlights a resilience of their aggregate conviction.
 Glassnode
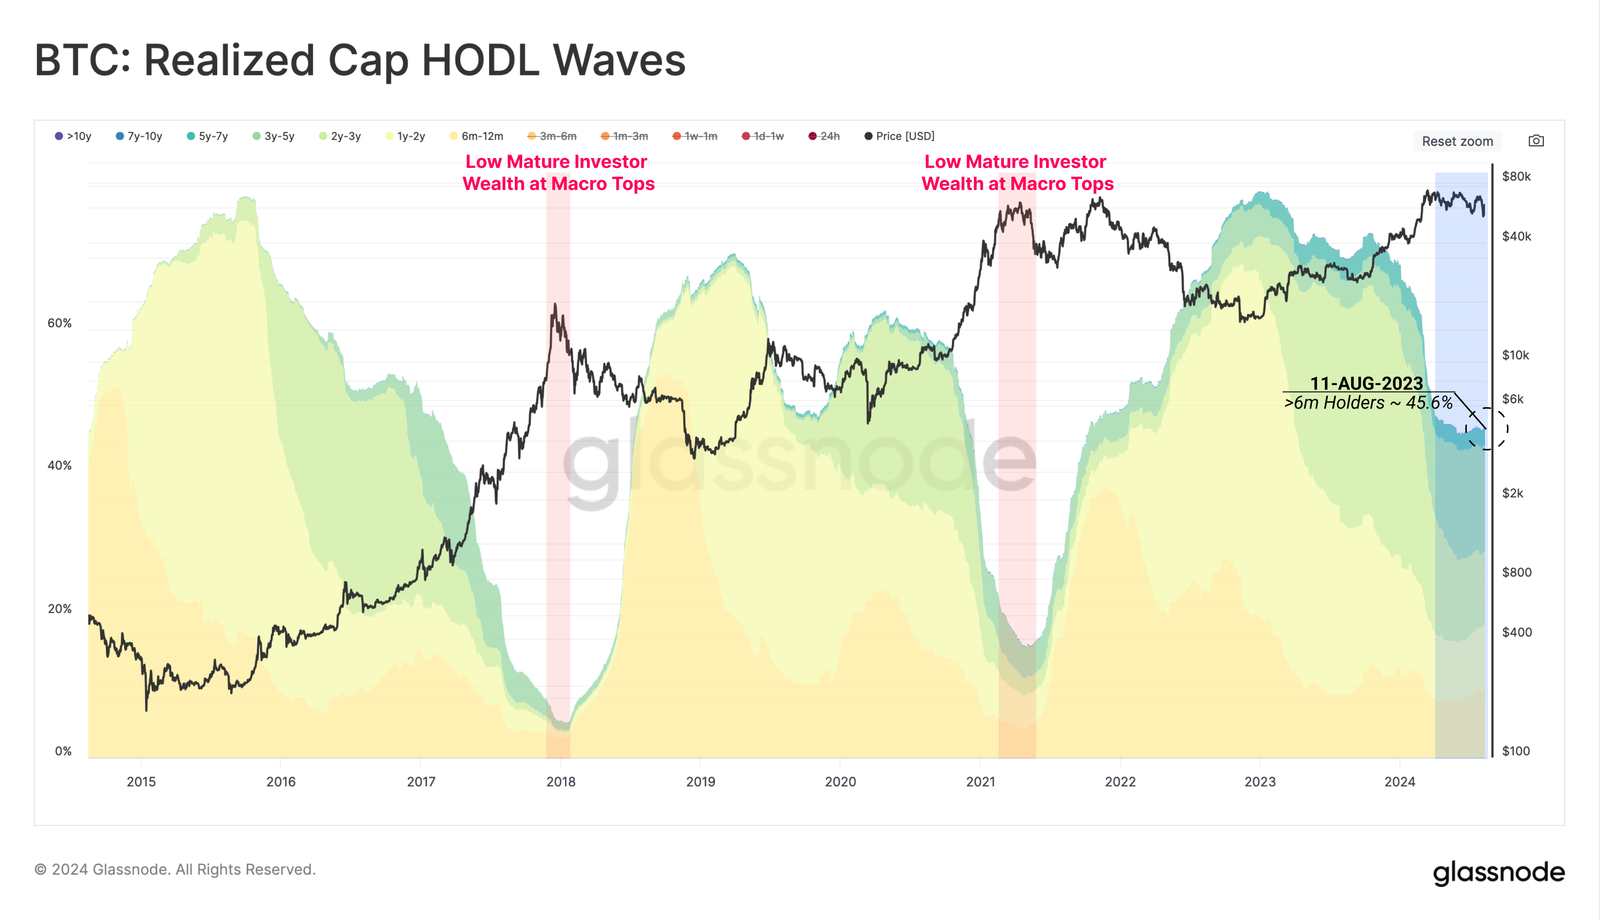
Miles Deutscher Discusses Future Market Trends and Investment Strategies
Building on this data-driven foundation, Aussie analyst Miles Deutscher offers a perspective on what these trends might indicate for future market movements. Deutscher says similarities to past charts are stunning. He compares the 2023 price action with the current situation to draw some conclusions about where we’re potentially headed next:
If it’s any indicator of what’s next, expect a few more weeks of apathy, a final scare, and then massive expansion to the upside in Q4/Q1.
 Miles Deutscher
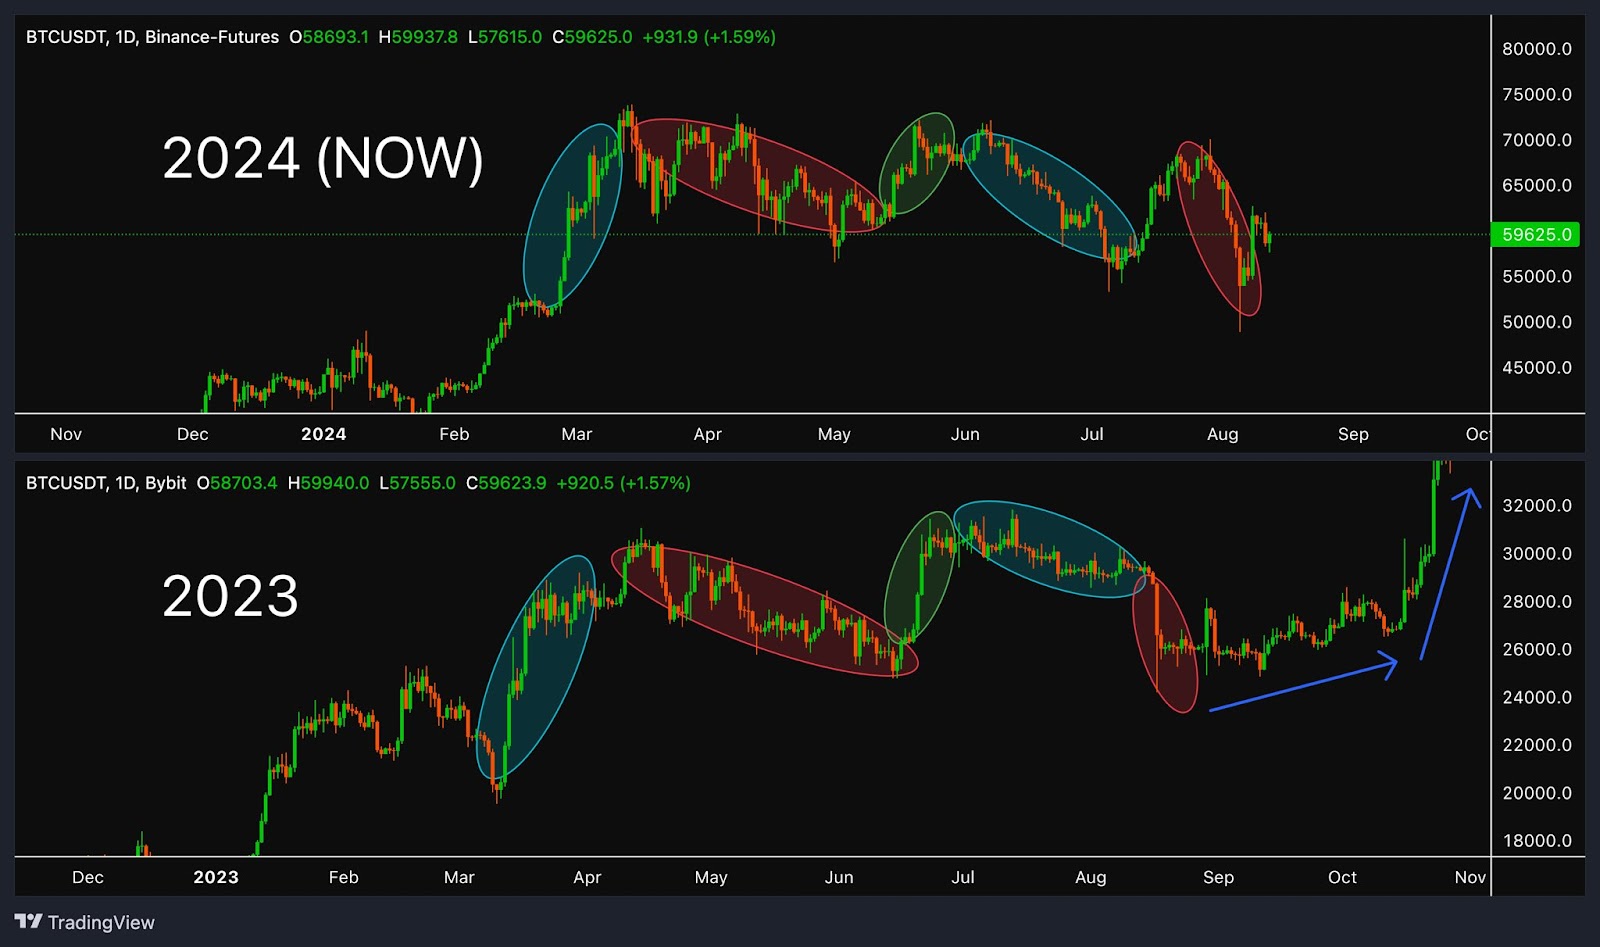
In a previous post, Deutscher gave some valuable insight for those who aren’t yet invested in crypto. He says, if holding 100% stablecoins, the strategy would be to deploy 70% into the market while retaining 30% for short-term trading.
Initially, Deutscher would invest 20% straight away as it’s “riskier not to be exposed than to be exposed”.
Related: Miles Deutscher Reveals Strategy for Becoming a Memecoin Millionaire
Over the next two months, he’d incrementally invest another 20% in coins with strong narratives and stable performance.
The remaining 30% should be used when the market confirms a “strong uptrend across strong altcoins”, targeting the most explosive phases of the market cycle. This method focuses on both immediate market engagement and strategic allocations timed with expected market movements.
Source:
https%3A%2F%2Fcryptonews.com.au%2Fnews%2Fhodl-on-glassnode-data-and-analyst-insights-reveal-trends-in-crypto-market-patterns-122751%2F