- Brandt noted in an X post on August 5 that the recent Bitcoin price decline post-halving follows a similar pattern ahead of the 2016 bull run.
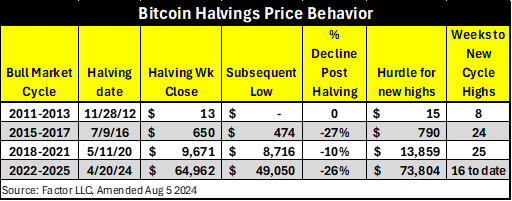
- The analyst compared the depth of market corrections since the halving dates, highlighting how in 2016, BTC dropped 26% within a month before surging to new ATHs.
- A similar pattern played out recently. However, Brandt also considers the possibility that the top has already been reached.
Peter Brandt, a renowned veteran trader and crypto analyst, believes Bitcoin’s post-halving price decline mirrors the market patterns observed ahead of the 2016 bull run.
Well, it’s playing out quite similarly when you look at the charts; after the 2016 halving—which took place on July 9, when BTC was priced at around US$650 (AU$990)—Bitcoin experienced a 27% drop before it surged to a record high of US$20,000 (AU$30,496) in December 2017.
Interestingly, BTC’s recent dip below US$50K (AU$76.2K) represents a 26% decrease from its post-halving weekly close of US$64.9K (AU$98.9K).
Related: Crypto Market Suffers Largest Drop Since 2022, as BTC Drops Briefly Below US$50K
On his X account, Brandt noticed BTC’s market patterns throughout its history, showing how BTC’s decline is “similar to that of the 2015 – 2017 halving bull market cycle”.
According to CoinMarketCap data, Bitcoin’s current price is over US$ 56.7K (AU $86.4K), a positive change of 1.95% in the daily chart and… a decline of 14% in the last seven days. Trading volumes are also in the gutter—down nearly 50% in the last 24 hours.
Likewise, after falling to US$1.9 trillion (AU$2.89 tn), the crypto market has managed to recover some losses, now at US$2.01 trillion (AU$3.06 tn), a 1.99% increase in 24 hours. Most cryptocurrencies, or at least the top 10 to 20 in terms of market cap, were in the green today, but just by small numbers.
At least it’s some relief from the bloodshed we witnessed at the beginning of the week. Naturally, the Fear & Greed Index is at 43, still in the neutral zone.
Related: Japanese Market Rebounds as Metaplanet Buys US$58M in Bitcoin
Caution Ahead
Interestingly, Brandt also pointed to a chart from an analyst that depicts a cycle top, meaning that he’s covering all possibilities.
This is a brilliant chart posted by a very smart person — and must be taken seriously when trying to grasp an understanding of binary price possibilities for Bitcoin.
 Peter Brandt
 However, users in the comment section were divided, with some considering the possibility that the top has already been reached and some stating that it’s a premature idea.
Source:
https%3A%2F%2Fcryptonews.com.au%2Fnews%2Fpeter-brandt-draws-parallels-between-recent-crypto-crash-and-2016s-bull-run-onset-122629%2F