A closely followed crypto strategist says Bitcoin (BTC) just flashed a signal last seen before the dramatic rallies of the 2017 bull market cycle.
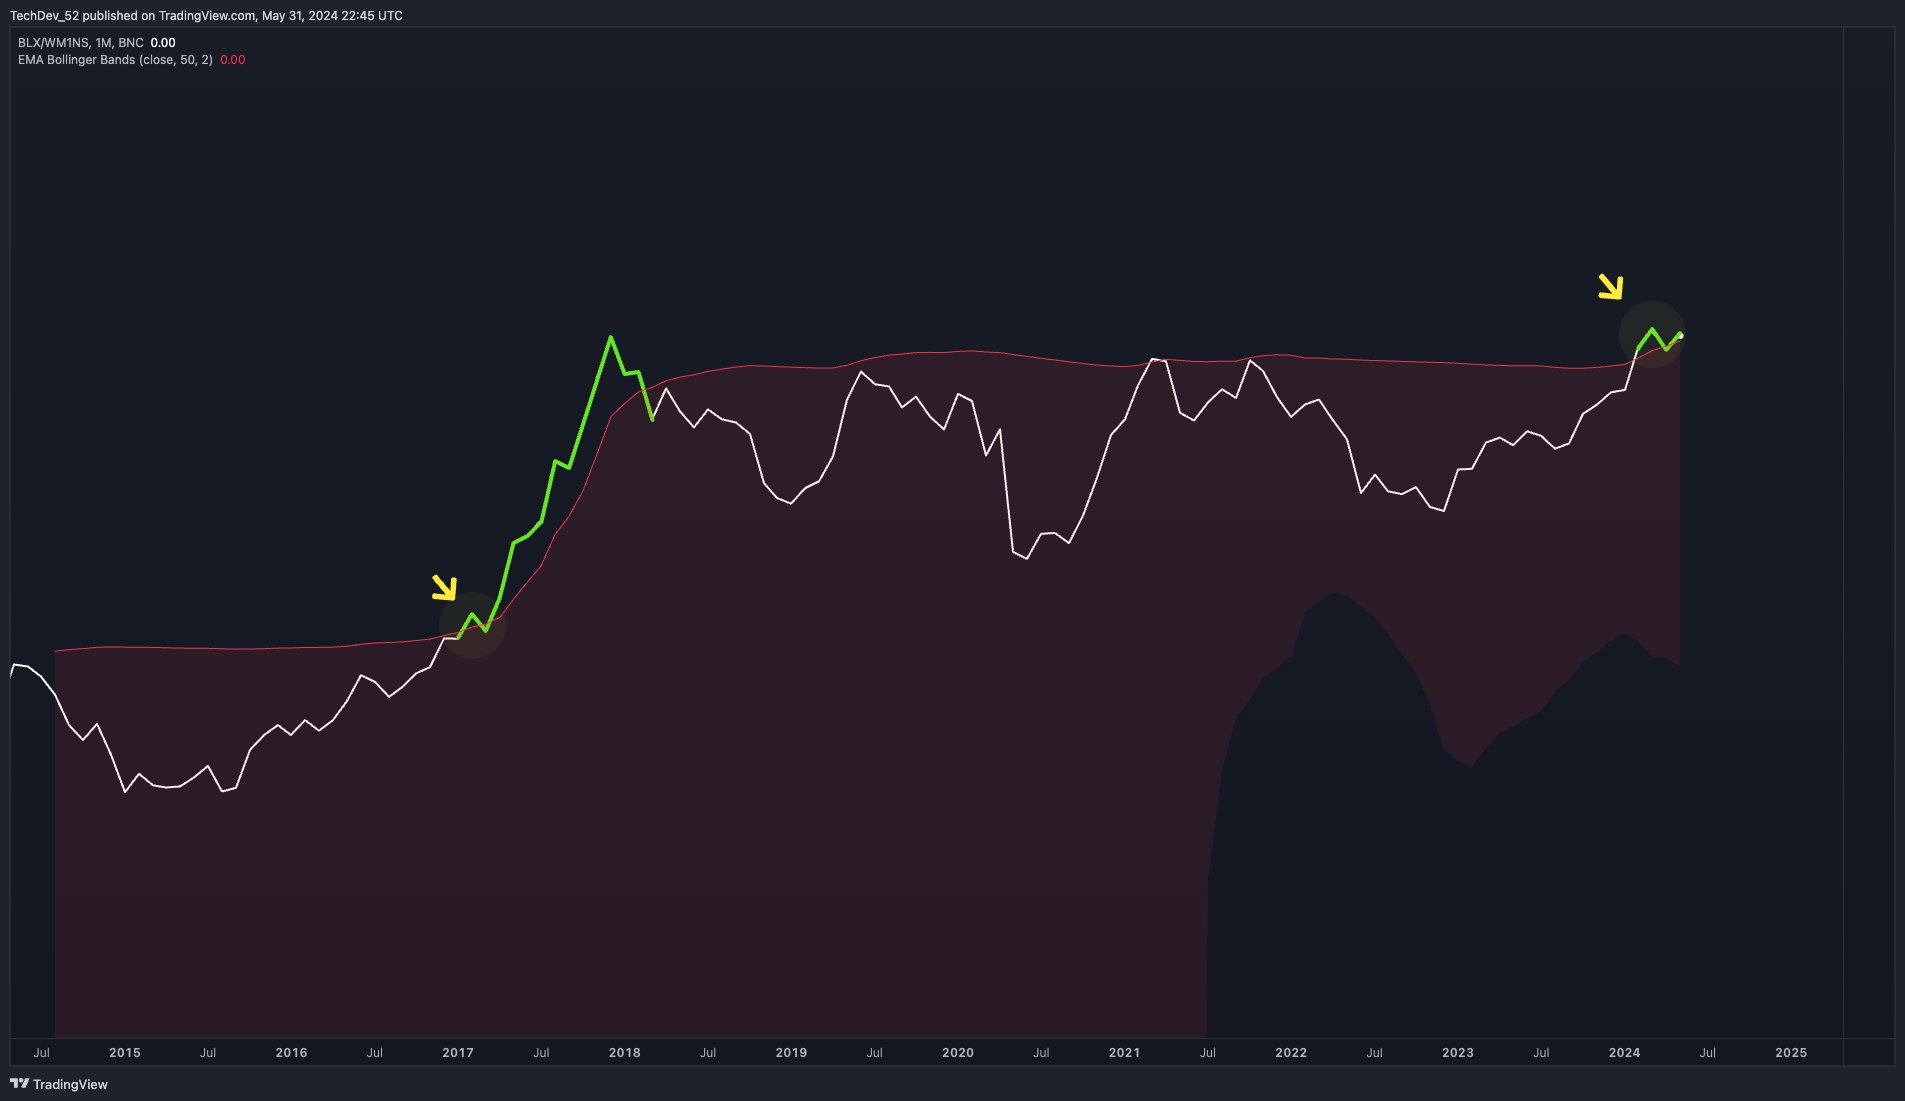
Pseudonymous analyst TechDev tells his 452,600 followers on the social media platform X that the Bitcoin versus M1 money supply chart just breached the resistance of the exponential moving average Bollinger Bands on the monthly chart.
According to TechDev, the same thing happened in the first months of 2017 before Bitcoin printed gains of more than 2,600% in less than a year.
“You’re looking at the first breakout of Bitcoin against M1 money supply since March 2017 when it went historically parabolic for nine months.”


M1 money supply tracks the amount of liquidity sloshing in the US financial system by summing up all physical money including coins and currency, demand deposits, traveler’s checks and other checkable deposits.
According to TechDev, the signal suggests that traders and investors are underestimating the upside potential of Bitcoin in this market cycle.
“Comparisons and trend projections involving 2021 may end up dramatically underestimating things…
One interpretation:
In 2021, BTC was carried to new USD highs by increased money supply.
In 2024, it’s gotten there on its own demand (and thus broke out against M1).
Add the anticipated M1 growth this time and we likely see BTC outpace expectations based in part on 2021.”
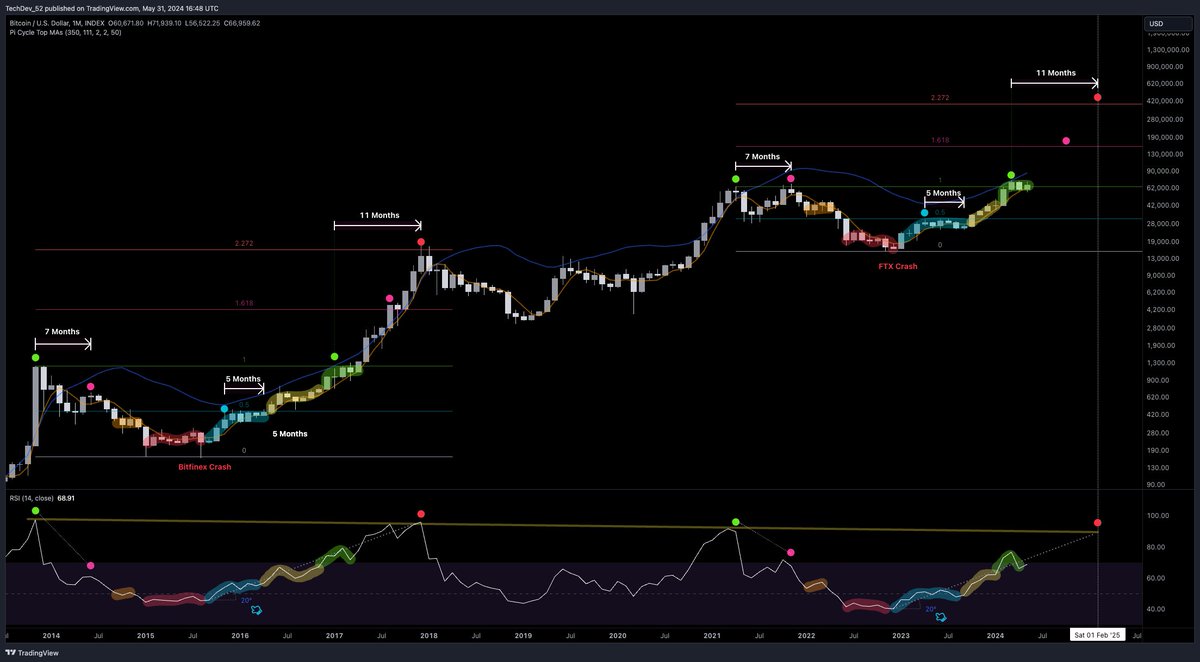
TechDev says that BTC may soar to over $400,000 in less than one year if it follows in the footsteps of the 2017 bull market.
“I know it’s ridiculous. Not my call. $70,000 > $420,000 in a year sounds crazy as $1,0000 > $20,000 did. I wouldn’t have called that either.”


At time of writing, Bitcoin is trading at $67,844.
Generated Image: DALLE3
Source:
https%3A%2F%2Fcryptonews.com.au%2Fnews%2Fbitcoin-flashing-signal-that-preceded-nine-month-parabolic-rally-according-to-crypto-strategist-121276%2F