A mixed bag of results this week as Bitcoin closed off last week’s trading with a modest 1.27% gain after what could be considered the big news week for the month. We’ve seen a spike in movement overnight, with Bitcoin now trading at $44,500 USD. The real question is, will this movement be sustained? Or is this simply a bull trap in the making?
It’s a very lean week for data. There isn’t much impactful macroeconomic data released this week, but this is a good opportunity to look back at the past. Let’s look at some seasonal data on the performance of the US dollar to garner some insights.
Historic Seasonality Of The US Dollar
On the topic of data, I wanted to direct some attention to seasonality. Seasonality in economics refers to the periodic fluctuations across commonly measured metrics (such as CPI, PPI, Jobs data, and other indexes) monitoring the economic activity over the course of a year.
The chart below visualises the seasonality of the US Dollar Index (DXY) over the last 20 years; this tracks the performance of the US currency.
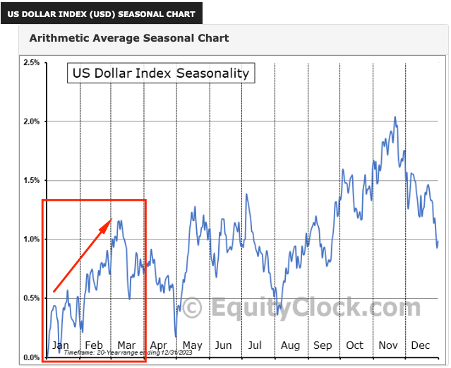
US Dollar Index (USD) seasonal chart for the last 20-years – Source Equity Clock
Why This Matters
Strength in the US dollar currency is often met with lower valuations of digital assets, as global liquidity is traded in USD. Therefore, it can stand to reason that the stronger the USD, the harder it becomes for Crypto to increase in value.
Where Are We Now
The DXY is currently up to the tune of +2.58% at this time of writing. Looking at seasonality, the 20-year average for Q1 is approximately 1.1%-1.2% which is normally reached by the start of March.
Overcooked Or Time Left On The Clock?
Does the market care more about how far ahead of the average we are to justify a cool-off? Or must we let the necessary historic trend play out over the coming weeks? Will be an interesting one to track.
Bitcoin – BTC
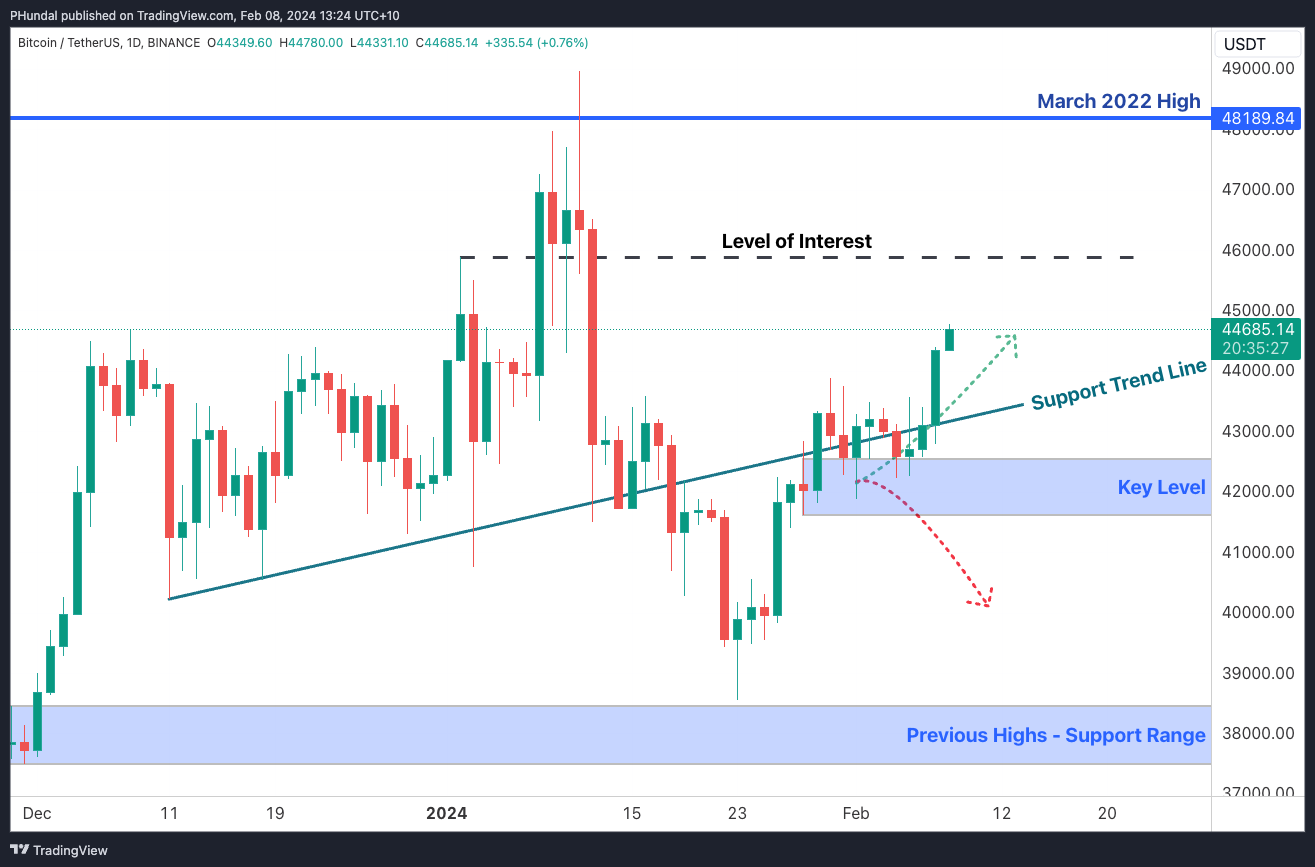
We’ve had the bullish scenario pan out from our last update. The key level in blue in the image below generated a move that has successfully developed a new high, as Bitcoin is currently at $44,500 USD.
A few headwinds are pushing against this move, which I covered in my latest video on Crypto with Pav. For example, Q1 seasonality for Bitcoin in a halving year, US dollar strength historically has risen in Q1, and Bitcoin is tagging key confluent levels. Click here to watch me explain it in more detail.
Two scenarios to watch for over the coming days leading into the weekend.
Bullish scenario
Bitcoin bulls continue to hold prices towards the next level of interest (dotted line), where we may see further buyers step in and potentially set up a new 2024 high.
Bearish scenario
Bulls disappear, and Bitcoin falls below the Support Trend Line in green. This may set up the market structure for the next move lower.
Reminder! Altcoins are often hyper-reactive to the sentiment on Bitcoin, so I am expecting volatility pending the outcome.
Polkadot – DOT
While Polkadot hasn’t had many fundamental reasons to stand out from the crowd, it is putting in a technical structure that may be worth paying attention to for a reaction.
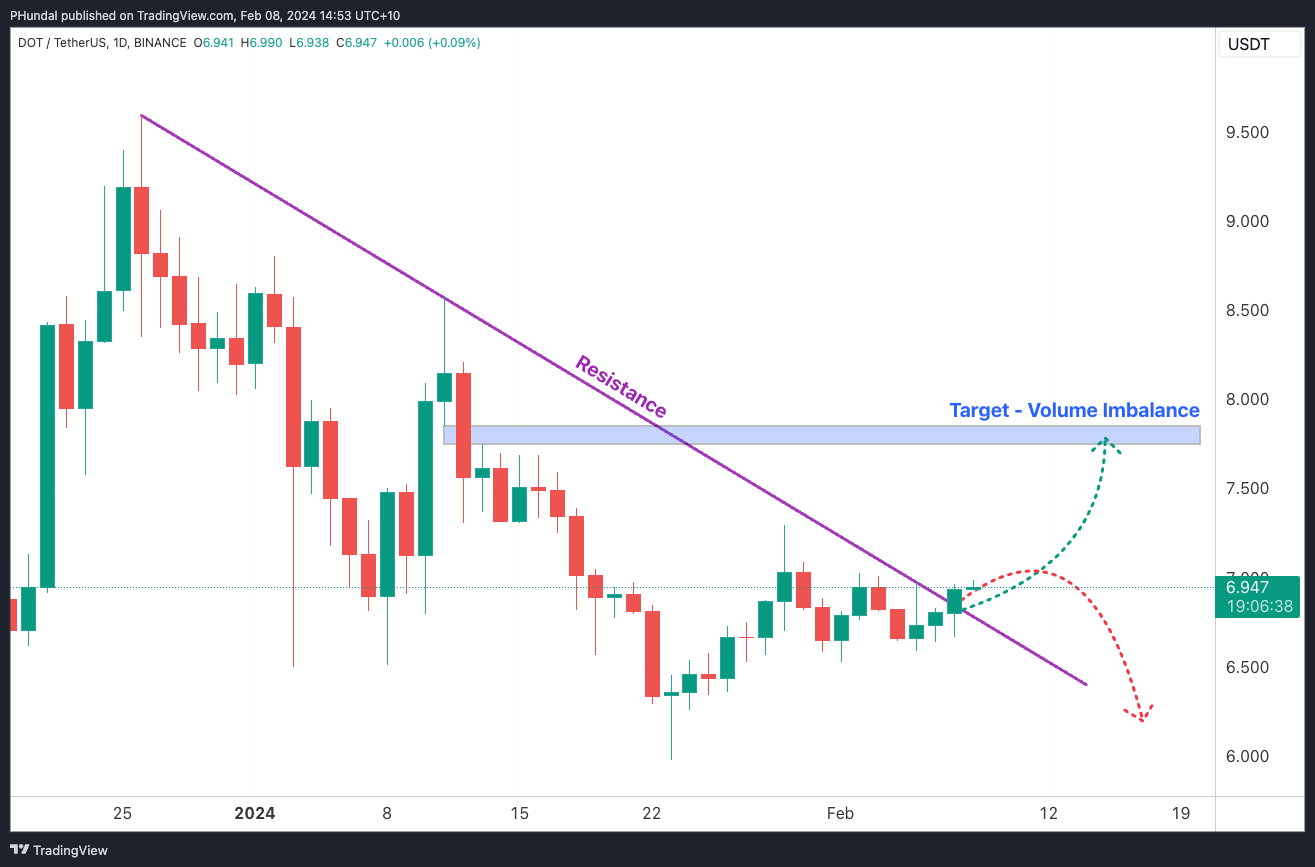
Polkdat has just broken a resistance level on a daily time frame that has been developing for the last 43 days. Here are two scenarios that may play out as we wait for the next reaction, which may take some time.
Bullish scenario
Breakout is bullish – a move to the next area of structural significance—a volume imbalance at $7.85-$7.75, approximately an 11% appreciation from current valuations.
Bearish scenario
Breakout failure – a move below $5.98, creating a new low and invalidating the breakout.
Jupiter – JUP
Jupiter has been trending on socials, landing one (if not the biggest) airdrop we’ve seen in the crypto space with no real outages or technical hiccups. This is arguably one of the biggest projects to release a token across Crypto Twitter since they started building in 2021. Fundamentally speaking, here are some fast facts from January 2024:
1. Most used trading platform in DeFi
2. Direct 80% of organic volume
3. Most used program in Solana
4. #2 by volume on Coingecko
5. Most integrated platform on Solana
6. One of the top perpetual contract platforms ($1.4B USD volume in the last week of January 2024)
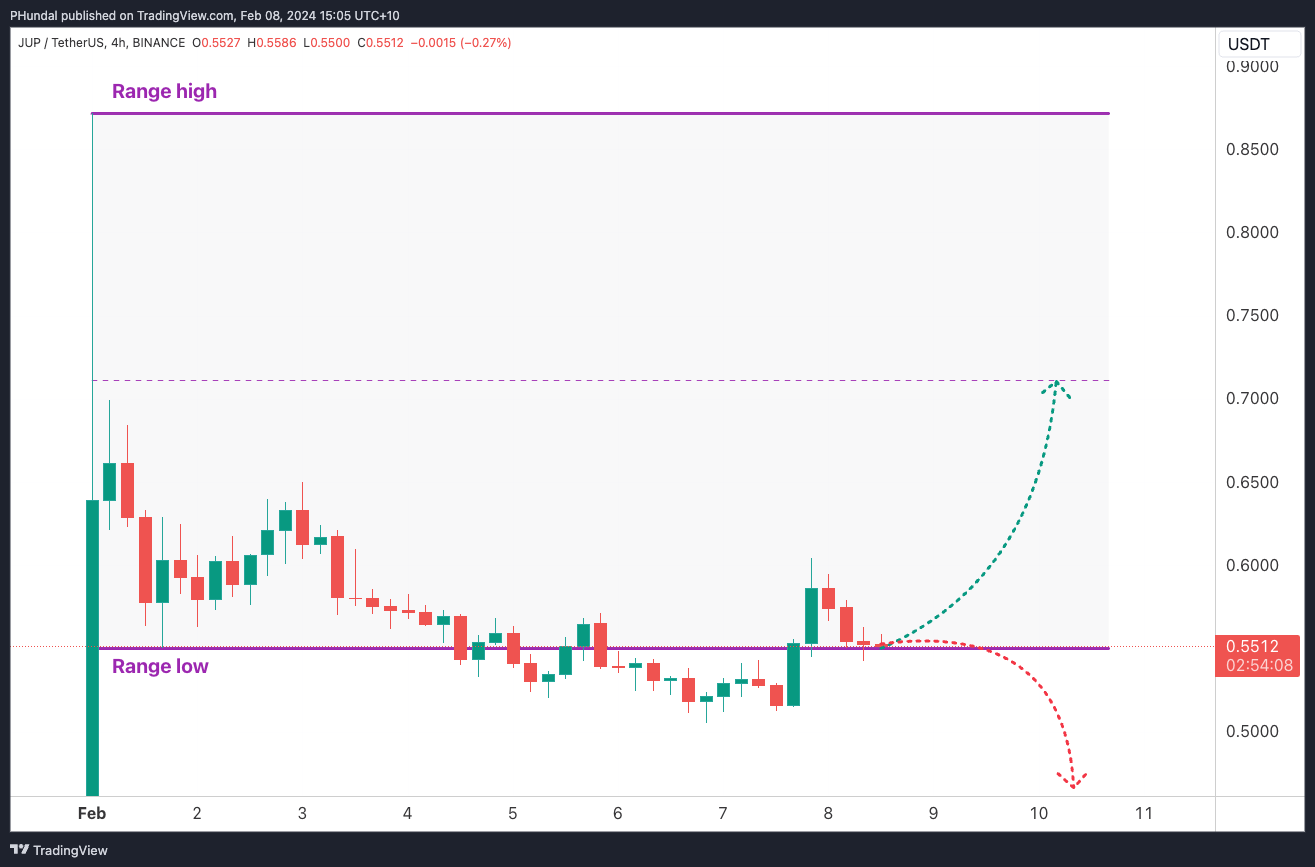
Price is currently trading at a key area of support based on the range channel depicted above. Taking the most recent high and subsequent low – here are two potential outcomes based on market structure.
Bullish scenario
A move higher – towards the midpoint of the range, where it will likely consolidate to move higher or lower based on market conditions.
Bearish scenario
A move lower – bulls are simply not interested enough, and supply is plentiful. Falling under this level may result in a further move lower.
See you all again next week.
_________________________
Keep up to date
I’ve recently launched my own YouTube channel Crypto with Pav where I walkthrough and explain what to expect next in Crypto and share the news I find important. You can also follow me over at X for regular updates.
Enjoy!